")
")
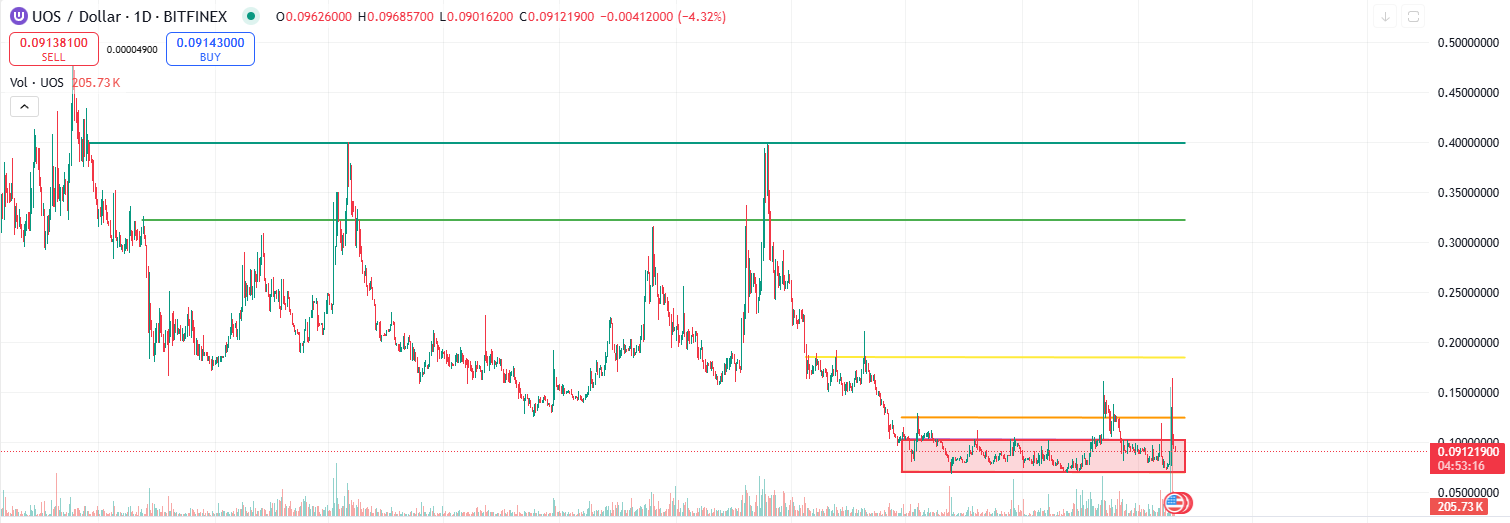
1. Price Action and Market Structure
The UOS token, native to the Ultra ecosystem, has been experiencing significant volatility, particularly due to high trading volumes on Bithumb.
This increased activity, likely driven by wash trading or arbitrage, has made price movements unpredictable, with sudden spikes and dips. Despite this, technical analysis provides clear support and resistance levels that traders can use to navigate the market.
Support and Resistance Zones
- Support: The most critical support zone is between $0.069 and $0.07. This level has been tested multiple times, showing strong buyer interest. A break below could signal further downside movement.
- Accumulation Range: UOS has been trading within a consolidation range of $0.073 to $0.1026. A breakout from this zone will determine the next directional move.
- Key Resistances:
- $0.1246 – First significant resistance. A breakout above this level could indicate the beginning of a new uptrend.
- $0.1853 – Historically strong resistance. Breaking this level would confirm bullish momentum.
- $0.3219 – A crucial pivot level, often used as a take-profit target by traders.
- $0.4004 – A psychological resistance that, if breached, could lead to parabolic price action.
2. Technical Indicators and Market Signals
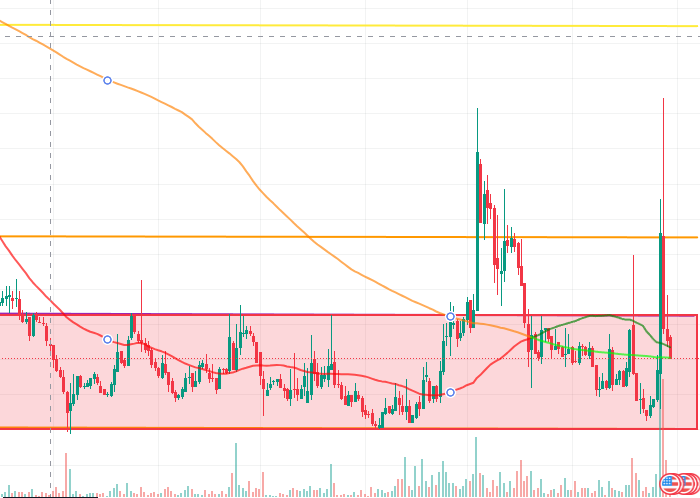
Moving Averages
UOS recently formed a Golden Cross, as the 50-day moving average (MA50) crossed above the 200-day moving average (MA200). This is typically considered a bullish signal, indicating a potential trend reversal. However, the price remains within a consolidation range, and a strong breakout above key resistance levels would be needed to confirm an uptrend. If UOS holds above MA50 and MA200, it could attract more buyers and push higher.
Relative Strength Index (RSI)
The RSI is fluctuating between 30 and 70, reflecting alternating periods of overbought and oversold conditions. Currently, RSI is around 50, suggesting a neutral sentiment. A breakout above 70 would indicate a strong buying momentum, while a drop below 30 could signal oversold conditions and a potential rebound.
MACD (Moving Average Convergence Divergence)
The MACD recently formed a bullish crossover, signaling a potential trend reversal. If the MACD histogram continues expanding positively, it would confirm strong bullish momentum. However, if the MACD line starts declining, it could indicate weakening momentum and a possible correction.

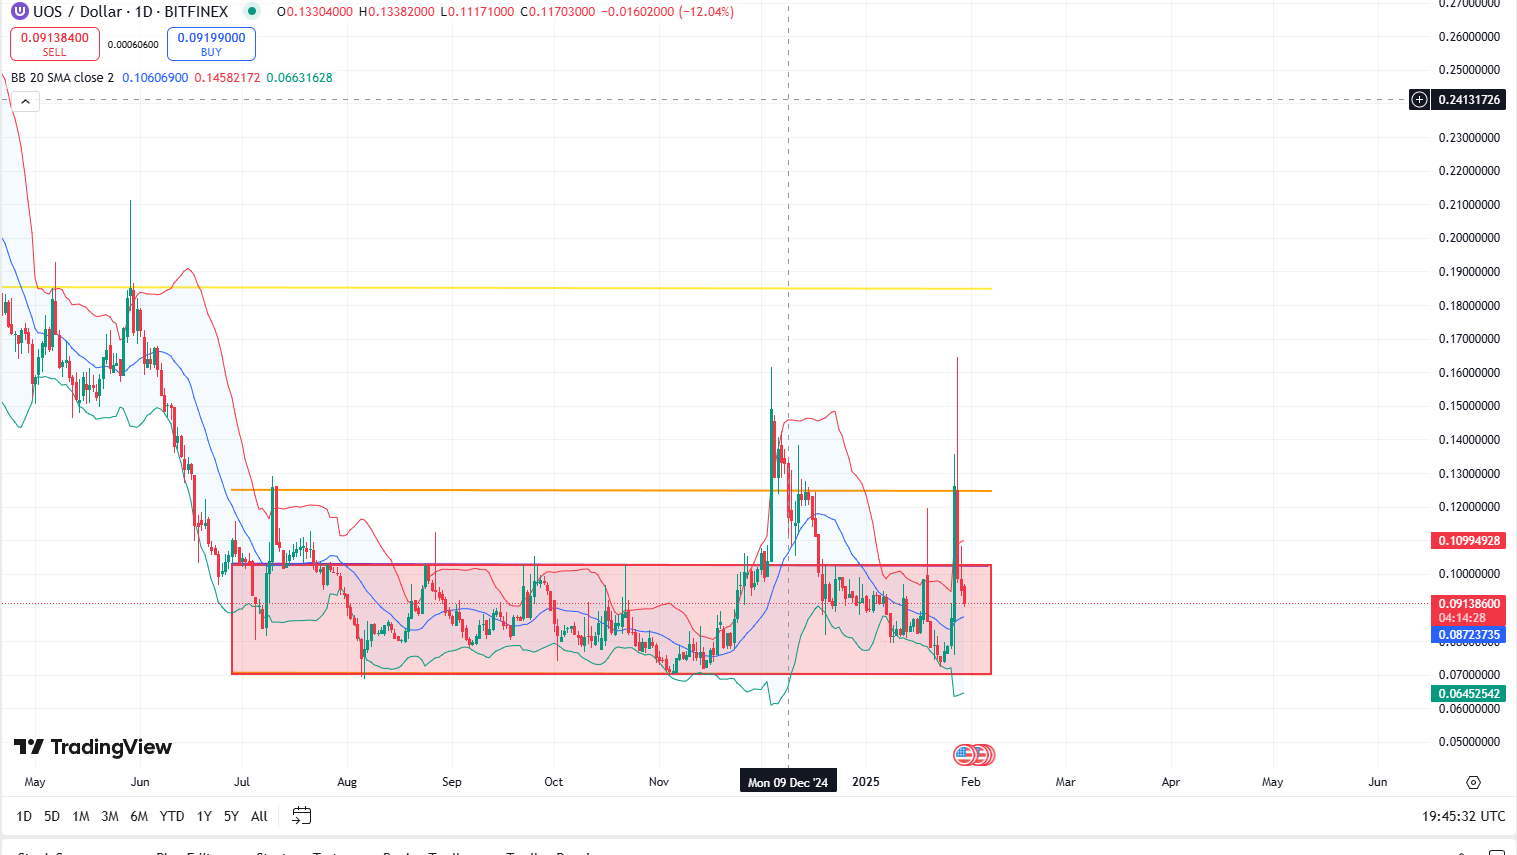
Bollinger Bands
UOS has been trading within a prolonged range (highlighted in red), indicating consolidation. A recent spike broke above the range but was quickly rejected, suggesting strong resistance. The price is now back within the range, near the lower Bollinger Band, signaling potential oversold conditions.
A Bollinger Band squeeze is evident, hinting at a possible increase in volatility. If the price reclaims and holds above the range resistance, it could trigger a bullish breakout. Conversely, a breakdown below support may accelerate selling pressure.
3. Volume Analysis and Market Manipulation
On Monday, January 27, UOS recorded a trading volume of over $30 million, with most of it coming from Bithumb. This unusual activity suggests artificial price movements, likely due to wash trading or arbitrage strategies. Such manipulation can create false breakouts and sudden liquidity traps, making it essential for traders to confirm any movement with volume across multiple exchanges.
4. Chart Patterns and Potential Scenarios
Graphically, UOS is forming a compression pattern, which typically leads to a breakout. The direction of this breakout will depend on whether the price surpasses $0.1026 resistance or falls below $0.07 support.
Bullish Scenario
- A breakout above $0.1026 with strong volume would signal the start of an uptrend.
- If UOS successfully flips $0.1246 into support, the next price targets are $0.1853 and $0.3219.
- Confirmation from increasing RSI and MACD would strengthen this bullish case.
Bearish Scenario
- A rejection at $0.1026 could lead to further consolidation.
- A breakdown below $0.07 might trigger stop-losses, pushing UOS towards $0.05 support zone, which would be very bearish.
- In this case, traders should wait for a reversal signal before re-entering.
5. Fundamental Outlook and Catalysts
While short-term price action is highly volatile, the fundamental outlook for UOS remains strong. Several upcoming developments could positively impact its valuation:
- EVM Compatibility: Expanding UOS to Ethereum’s ecosystem will increase adoption and liquidity.
- Launch of "Ashes of Mankind": A successful game release could drive user adoption and demand for UOS.
- Massive Marketing Launch: A comprehensive marketing campaign will raise awareness and attract a wider user base
- Significant Partnerships: Strategic collaborations with key industry players will increase credibility and expand the reach of UOS across multiple sectors.
- New Game Releases: The introduction of additional games to the Ultra ecosystem will enhance platform engagement and fuel demand for UOS tokens.
6. Conclusion and Trading Strategy
Given the current price action, UOS remains in an accumulation phase, with $0.07 as critical support and $0.1026 as resistance. Traders should monitor volume spikes and breakout confirmations before entering positions.
For short-term traders, buying near support levels and taking profits at key resistances remains the best approach.
For long-term investors, holding through fundamental developments may offer greater upside potential.
With market conditions still uncertain, risk management is crucial—watch for stop-loss levels, avoid overleveraging, and confirm trends with multiple indicators.
If the market sentiment shifts bullish, UOS could reclaim $0.1853 and beyond, while a failure to hold support may lead to a retest of lower levels.
Article written by thybow
